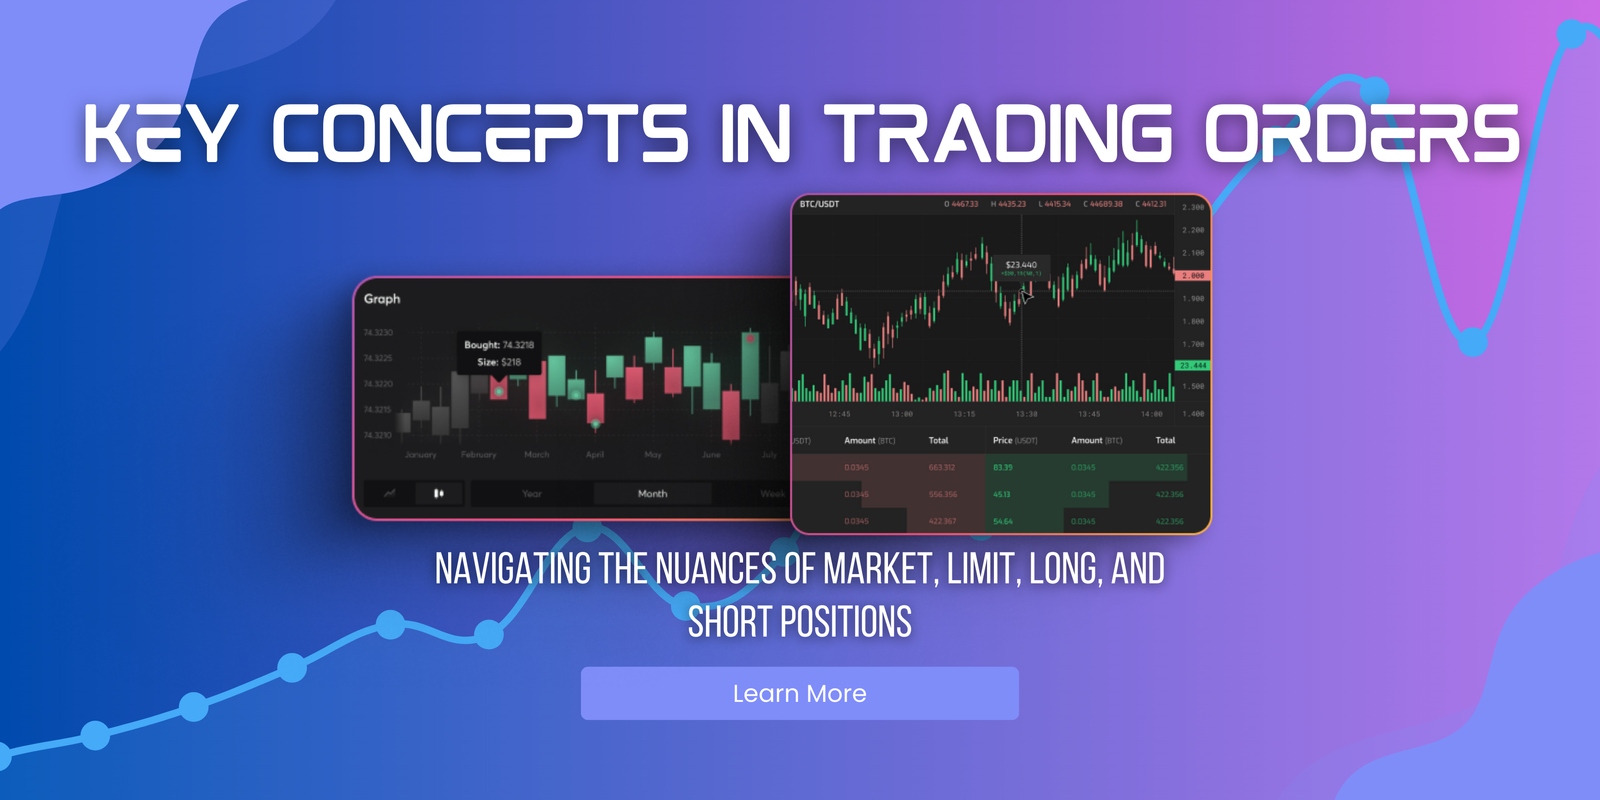
In the realm of financial markets, whether you're navigating the turbulent waves of cryptocurrencies, the vast oceans of forex, the sprawling landscapes of stocks, or the diverse terrains of commodities, technical analysis stands as a crucial navigational tool. This analytical framework enables traders and investors to study historical price movements and indicators to predict future …
The Art of Technical Analysis | Decoding Market Movements

In the realm of financial markets, whether you’re navigating the turbulent waves of cryptocurrencies, the vast oceans of forex, the sprawling landscapes of stocks, or the diverse terrains of commodities, technical analysis stands as a crucial navigational tool. This analytical framework enables traders and investors to study historical price movements and indicators to predict future market behavior. This article explores the fundamentals, tools, and practical applications of technical analysis, offering insights into how it can be harnessed to make informed trading decisions.
Understanding Technical Analysis
At its core, technical analysis is the study of market action, primarily through the use of charts, for the purpose of forecasting future price trends. Unlike fundamental analysis, which looks at economic factors and company metrics, technical analysis focuses on price movements and trading volumes, operating on the premise that history tends to repeat itself.
The Tools of the Trade
Technical analysis employs a variety of tools and indicators, each offering a different lens through which to view the market. These include:
Price Charts: The backbone of technical analysis, charts range from simple line charts to more complex candlestick and bar charts, each providing insights into market sentiment and potential price movements.
Trend Lines and Channels: These tools help identify the direction of the market movement, whether it’s upward, downward, or sideways, and are pivotal in determining support and resistance levels.
Moving Averages: Averaging price data over specific periods can smooth out short-term fluctuations, revealing underlying trends.
Momentum Indicators: Tools like the Relative Strength Index (RSI) and MACD (Moving Average Convergence Divergence) help gauge the strength of a trend and identify potential reversal points.
Volume Indicators: Analyzing trading volume can confirm the strength of a price move, with higher volumes often indicating stronger trends.
Applying Technical Analysis
The practical application of technical analysis involves a methodical approach:
Identify the Trend: The first step is to determine the overall trend, as this will guide your trading decisions. Are prices generally moving up, down, or sideways?
Find Support and Resistance Levels: These are price points where the market repeatedly fails to break through, serving as indicators for entry or exit points.
Use Indicators and Oscillators: Apply the tools mentioned to identify potential buy or sell signals and gauge market momentum.
Volume Analysis: Confirm your analysis with volume, as it can provide clues about the strength of a price move.
Pattern Recognition: Chart patterns, like head and shoulders, triangles, and flags, can indicate continuation or reversal of trends.
The Importance of a Disciplined Approach
Successful technical analysis is not just about knowing which tools to use but also about applying them within a disciplined and consistent framework. It requires practice, patience, and an openness to learning from the market. Moreover, combining technical analysis with a sound risk management strategy and an understanding of market psychology can significantly enhance its effectiveness.
Conclusion
Technical analysis is an invaluable skill for anyone looking to understand and anticipate market movements. By mastering its tools and principles, traders and investors can improve their ability to make informed decisions in the forex, crypto, stock, and commodity markets. As with any art, proficiency in technical analysis comes with time, experience, and a deep understanding of its nuances, offering a strategic edge in the pursuit of trading success.


